Fed Chair Powell stated in the 19th Sep FOMC press con that equity prices are “fairly highly valued”. We try to see if current US market valuations fit in the above context.
We first look at how equities have behaved in past when Fed Chairs have made such statements:
1. Fed Chair warnings on valuations have not triggered negative equity returns in the following 1M, 6M and 12M time period.
2. The positive average return in S&P 500 and international equities in one year after these warnings is modestly weaker than the one experienced in the 6M preceding them, suggesting slower appreciation, excluding the dotcom and the Covid periods, and broad US outperformance.
High valuations and extreme market concentration have prompted comparisons to the dotcom bubble, but key differences exist. Unlike the late 1990s, today’s growth stocks are delivering strong double-digit organic growth, strong margins (~25%), and returning capital to shareholders. Quality and Growth exposures remain central to justifying current valuations. While elevated valuations and crowded trades may signal fragility, a correction is more likely to be triggered by macroeconomic weakness than by valuations alone.
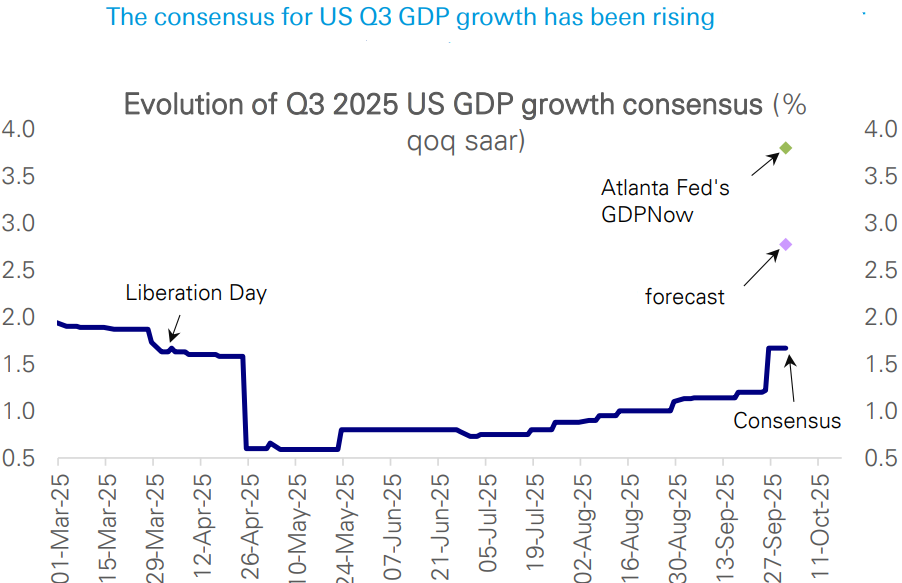
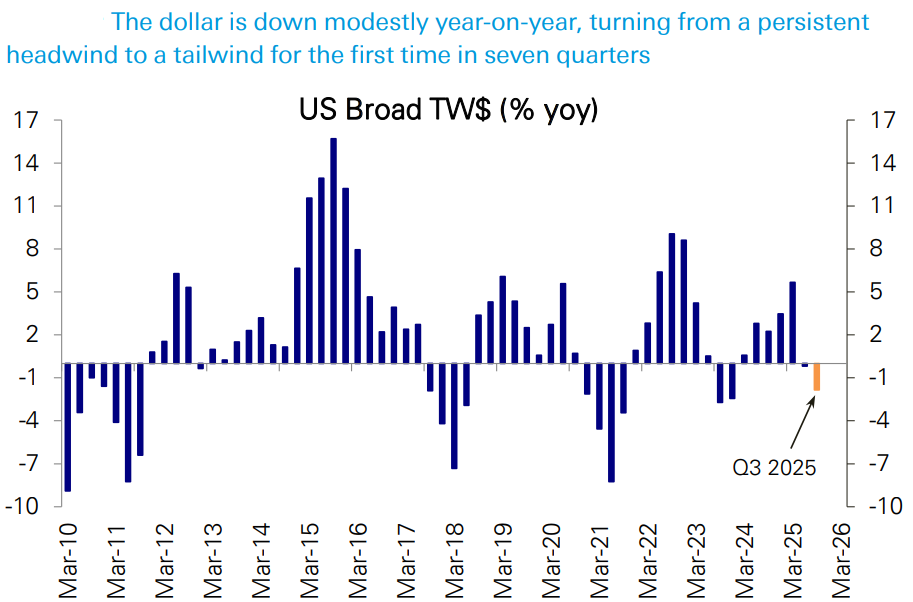
In fact, S&P 500 earnings growth has been hovering in a robust range around 11% for nearly 2 years. Will the Q3 earnings season continue the trend? The macro backdrop is favourable, in our view, with recent data pointing to solid growth in Q3 (we forecast US GDP growth at 2.9% while tracking estimates are pushing nearly 4%), the dollar turning from a headwind to a tailwind, a diminishing drag from falling oil prices, and continued strength for the secular growth sectors. Corporate guidance relative to consensus is the highest in four quarters.
We see earnings growth for the S&P 500 edging higher from 9.3% yoy in Q2 to 10.8% yoy in Q3. Growth should be concentrated again, as mega-cap growth (MCG) & Tech continue to do the heavy lifting with an assist from the Financials, while growth in other sectors remains subdued but rising. What about tariffs? With the impact so far proving modest and narrow, we estimate a -1pp overall drag in Q3, with some industries impacted disproportionately. Absent tariffs, growth would have been 11.8% or even higher.
US liquidity, or the stock of US M2 money supply, which we proxy by the sum of the stock of US commercial bank deposits and the AUM of US Money Market Funds (MMFs), keeps rising strongly.
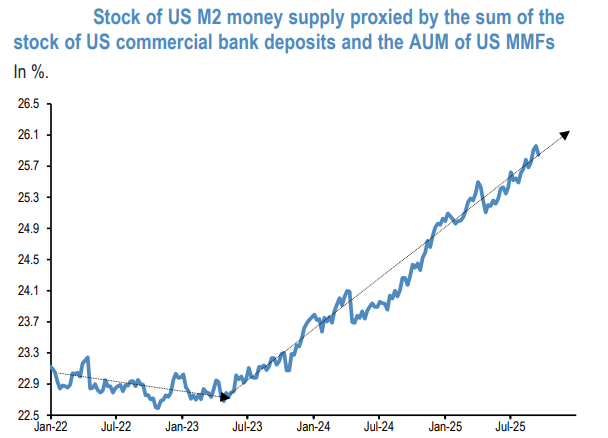
Thus far in 2025 it tracking an annualised pace of $1.2tr YTD, similar to last year. After expanding by $1tr from May 2023 to end-2023, US money supply increased by $1.2tr in 2024 bringing the cumulative increase from May 2023 to end2024 to $2.2tr or 9.6%. This strong pace of US money creation of the previous two years, faster than nominal GDP growth, appears to have continued this year. This liquidity is reverberating into financial assets and has likely been a factor in propagating US equities. With little sign of liquidity-inducing channels subsiding from the strong pace of the previous two years, a liquidity-driven propagation of US equities looks set to continue.
To summarise, while US equities do look elevated in terms of valuations, there are continued reasons for this over valuation. Only a macro risk event can undo current strong run of US equities.